
What Lemons Tell Us About Finding Wealth Building Stocks
When Life Gave Marta Lemons, She Made Limoncello Coolers…

Hi! Welcome back to the Rickhouse
Remember from previous posts, we are building up from the example of Marta and her lemon orchard in Italy…

Marta started small, selling lemons by the basket. It was seasonal, labor-intensive, and hard to scale.
Next, she began baking and delivering lemon tarts. Profits improved, but the business still relied heavily on her time and labor.
Then came the turning point: Marta partnered with a bottler to produce limoncello coolers and licensed her brand to a kiosk chain to sell them. Sales grew much faster, but Marta’s own company didn’t buy a bottling factory and a fleet of delivery trucks. Marta’s company did not take on all the labor or debt to make her limoncello coolers happen.
By adding partners and focusing on what she did best—developing new recipes—Marta increased her sales per employee and kept liabilities under control. Each stage required less direct labor and capital for every dollar of sales, freeing up resources for growth instead of just keeping the lights on. Her strategy to develop products and partnerships resulted in a company with high returns on equity; the partnerships handled more capacity without much added cost, all of which helped Marta steadily grow her company’s ROE.
Traditional value investing looks for cheap stocks, growth investing for rapid expansion. But Marta-like businesses optimize for scale—using partnerships, people, and expertise to scale faster than competitors while controlling risk. Amazon isn’t building airports. Netflix isn’t laying fiber optic cable so people can have faster internet. We intuitively know businesses rely on other businesses, but we may miss how well companies manage their partnerships when we think about selecting stocks.
How do we turn Marta-like principles into criteria for selecting stocks? How does all this about sales per employee and return on equity become useful for long term investors?
Here's where most investment books would lead you into a deep dark forest of formulas. But stick with me—the math that matters is surprisingly simple. Think of it like following a map: you need to understand how all the turns, on ramps, and exits come together to see how the route makes sense.
Let’s very briefly look at how companies actually understand whether or not they are making progress:
A Little Accounting 101
Let’s follow the thought process of how financial statements measure what happens in a company:
Net Income = Sales - Expenses. So, Net Income will increase if sales grow faster than expenses. Wages, salaries, benefits, office space, computers and software, and all the costs to make a company a productive and fulfilling place to work typically make up a large portion of total expenses. Increasing sales per employee is a signal that a company is both able to sell more stuff and empower its people to do so.
Change in Assets = Change in Liabilities + Change in Equity. This is a simplified way to think about the balance sheet. The increase in assets, especially if driven by sales growth that in turn drives income growth, is a good sign. Arithmetic says if liabilities are growing more slowly than assets, then the difference is “allocated” to the change in equity. ROE = change in equity / total equity. A consistently high level of ROE is a great sign of a healthy business. Coupling that with a growing ROE is a signal that a healthy company also knows how to profitably grow.
Which gets us back to where we started with Marta and her lemons. How do we spot companies in the middle of their own transition from labor-intensive operations to developing products that scale? The financial statements won't tell us about specific partnerships or strategic decisions, but they will show us the results: companies where sales are growing faster than headcount (higher sales per employee), where growth isn't requiring proportional increases in assets or debt, and where consistently high and growing ROE signals they're doing several things well simultaneously—growing sales, using assets effectively, and partnering smartly to fuel growth.
These metrics don't guarantee we're finding the next great stock, but they do help us identify companies where the numbers suggest something like Marta's scaling story is already happening.
But don’t forget—everyone else is looking for the same signals. The real edge comes from understanding how these metrics work together as a system.
A Stock Selection Framework
The guidelines below take a systems approach to the fundamentals of accounting. The guidelines start by identifying the inputs of the accounting metrics. What comes next is understanding what happens based on the decisions of employees, customers, managers, and executives. The metrics in the framework work together to show how those inputs become outputs investors can use for their decision making needs.
It starts with Sales. Over a business cycle, healthy companies grow sales faster than both income and assets. Efficiency, on its own, does not result in growth. A company may need to cut costs but lower costs do not translate into long term success. Real growth comes from consistently selling more products or services year after year.
Liabilities (debt) can help a company grow. However, if they grow too fast (faster than assets, faster than sales), then liabilities become a drag on income and return on equity. When liabilities outgrow assets for too many years, often trouble lies ahead.
So, assets should grow faster than liabilities. Another sign of healthy, sustainable asset growth? When sales are growing even faster than assets.
High and growing ROE. These two metrics are key signals showing the company is successfully managing everything else in the framework. Over a business cycle, high ROE signals a company is operating well. Growing ROE confirms to an investor that the company is finding partnerships, expertise, and other resources outside its walls to create more opportunities to increase sales while keeping costs in check.
Testing the Framework
The next step is translating those guidelines into a model. The model has two components. First is a set of criteria to rank stocks for how closely their recent financial performance follows the framework. The next component filters those stocks again for the companies with best productivity, ROE, and growth available for a reasonable price compared to their earnings growth.
The first test focuses on whether or not the ranking and selection rules work repeatedly over a long time frame. This test selects the 10 best stocks each September and holds them for 52 weeks. It simply repeats that cycle of buying and selling once each year and tallies up the returns of that series.
(One test proves nothing. I’ve run this test hundreds of times over many different time periods, with shorter and longer buy/sell periods, with more or fewer stocks selected each time. The results all follow the pattern demonstrated in this chart.)
The red line is the model’s result and the blue line is the S&P 500. The y-axis is linear; unfortunately the software doesn’t provide an option to plot the y-axis on a log scale.
September 2005 - September 2025:
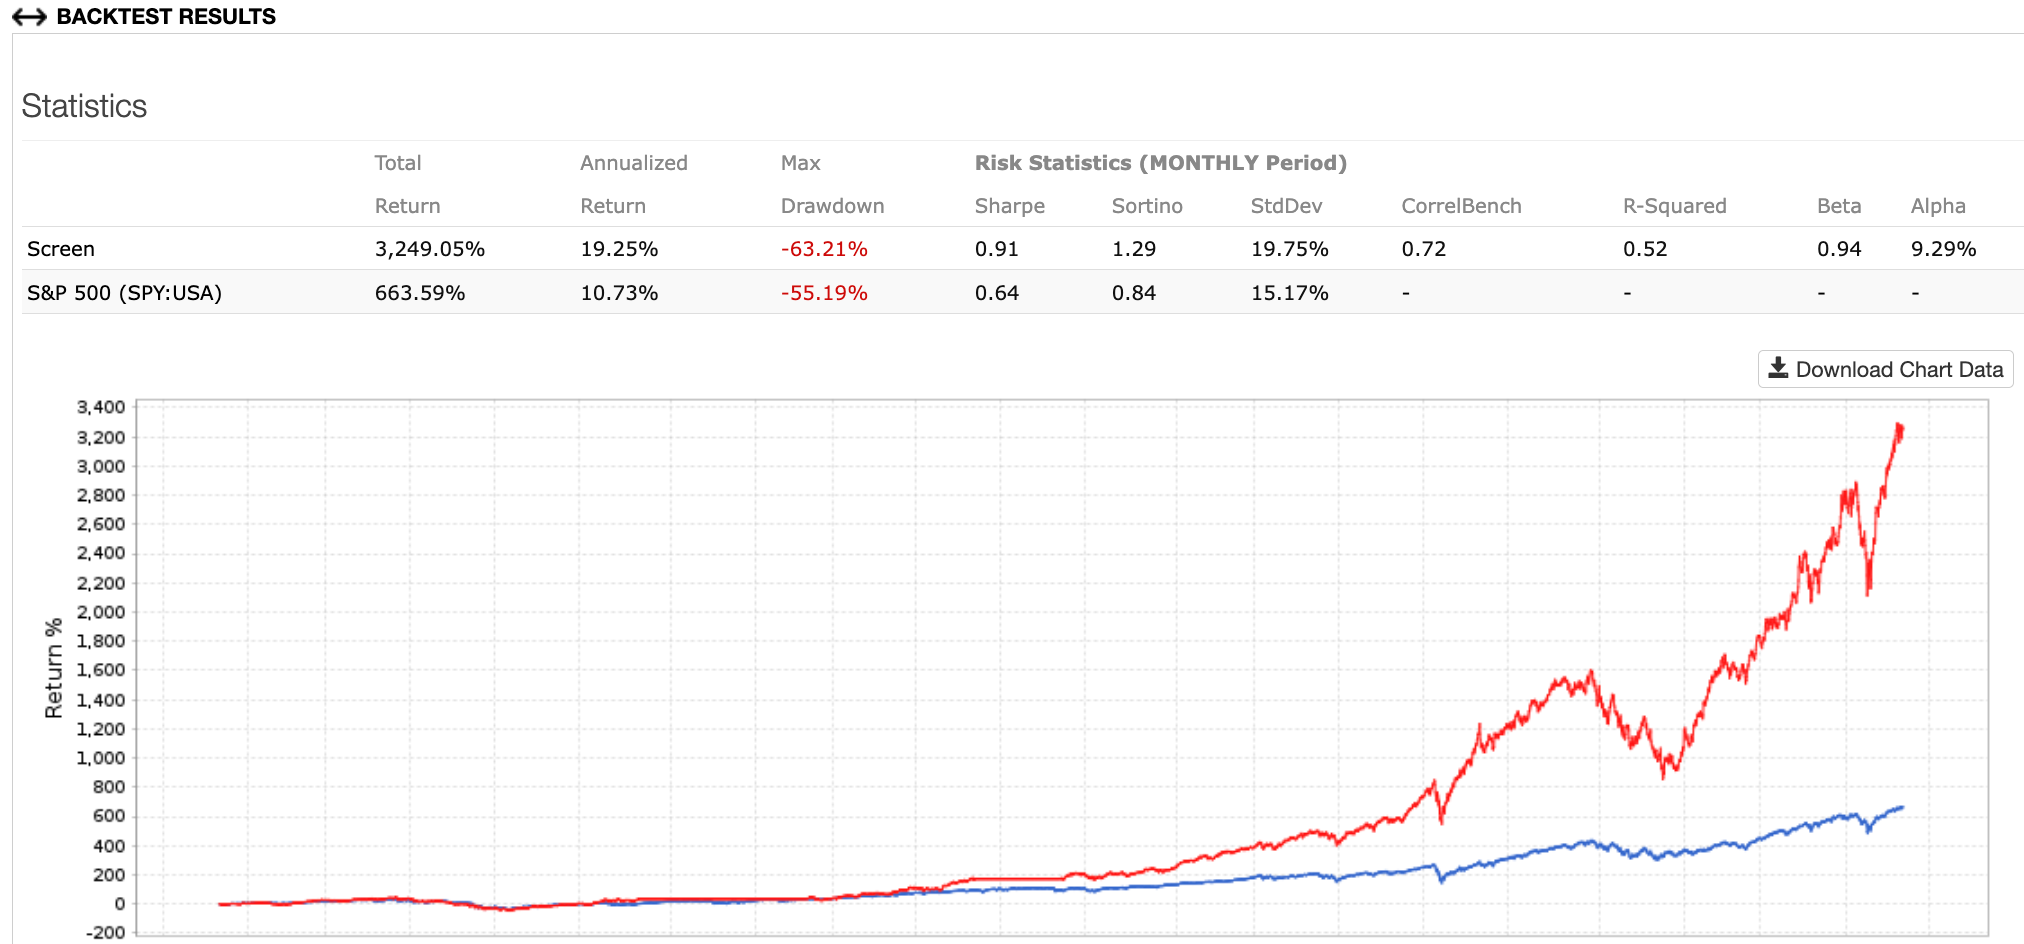
Those results look almost too good to be true, right? That's because they are—nobody mechanically buys a batch of stocks and then sells them all 365 days later, only to buy the next batch and repeat. That repeated annual buying and selling only tests whether the ranking and filtering stock selection method works across all types of markets, bull and bear.
The second test is more realistic - it’s a portfolio simulation using the ranking and selection criteria to buy a stock but also applying rules from the framework to trim a current holding if its growth or ROE decays and then ultimately sell that stock if the company can’t find a way to grow again.
The simulation holds no more than 50 stocks and checks its rules for selling and buying every 8 weeks. The simulation unfortunately can’t be instructed to buy more shares of stocks that are doing well against its criteria. However, it can buy back a company it sold earlier should that company meet the buying rules again. The good news is the rules do not lead to a lot of trading. The annual turnover for the stocks in the portfolio was just under 17%. (The S&P 500, designed not to move many companies into and out of the index, has annual turnover of about 5%.)
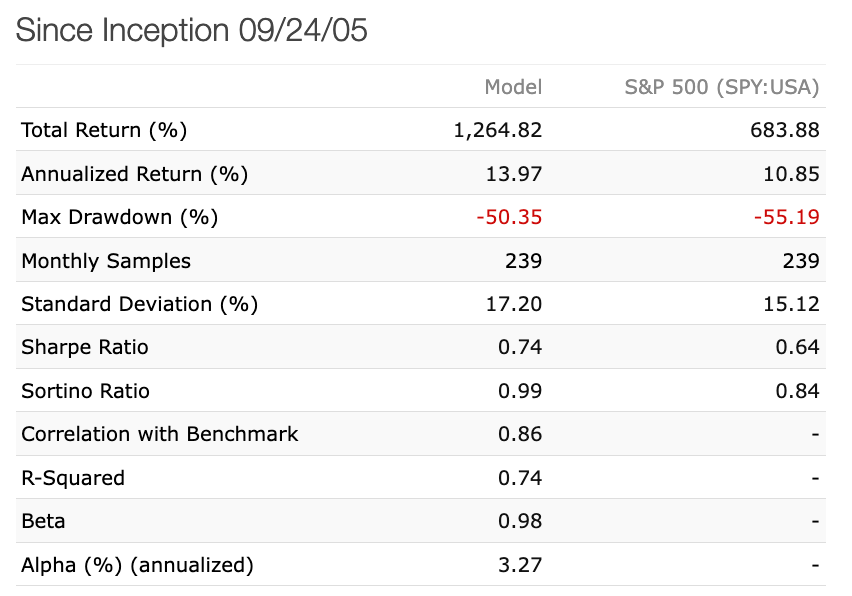
The simulation does really well, with a CAGR over the 20 years of just under 14% compared to about 11% for the S&P 500. Small advantages over time lead to a big advantage at the end of 20 years, with the total return from the model of about 1,260% compared to 680% for the S&P 500.
Thankfully, the chart of the simulation results can be plotted on a log y-axis.
September 2005 - September 2025:
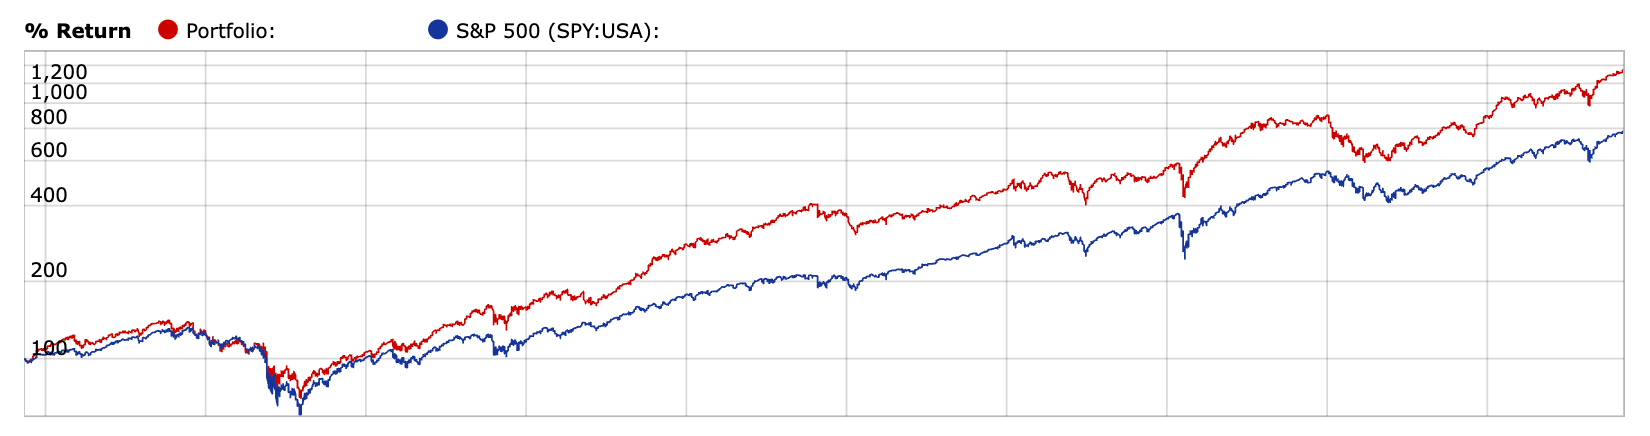
(Again, one run of the simulation means nothing. I’ve run this hundreds of times with variations of all the key aspects of the model, time periods, just before market crashes, just after market crashes, and so on. There aren’t many variations I haven’t tried. The results vary, but the pattern of the outcomes is consistent.)
What’s the Catch?
You should always be skeptical of any backtest of a portfolio or selection model. Let me highlight some of those watch-outs here:
The model software (Portfolio123) includes costs when it reports the results of a model, so trading costs and getting poor prices when making transactions are already reflected in these results.
Portfolio123 only has a limited data history (about 25 years). That may seem like a lot. But when you consider each of us has an “investing career” of about 70 years, covering our working years and retirement, the Portfolio123 data history is a bit short. That matters because all the model knows, given that period of stock market history, is the rise of technology companies and the relative underperformance by industrials, utilities, and other kinds of businesses that rely on heavy capital spending over long periods on things like factories or drug development testing before realizing profits on those expenditures. It’s possible that this framework and model won’t be effective in the future.
The simulation is pretty dumb when it comes to managing the 50 stocks it holds. It can’t add more funds to stocks where the company continues to do well. It doesn’t try to predict anything, so it can hold on too long to stocks where the company is clearly not doing well.
You might notice something important in the chart of these results: the model doesn't try to time the market. It just picks stocks that are best performing within the framework, trimming and eventually selling those doing worse on the metrics in the framework.. The power isn't in perfection—it's in consistently identifying companies where the fundamentals show the people and processes in a company are all pulling together in the right direction, and slowly letting go of stocks where the company may be showing signs of getting lost.
Which brings us back to where we started:
Wrapping Up
What Marta and her lemons show is a story about scale. Her breakthrough wasn't when she worked harder or even when she made better lemon tarts. It was when she understood that growth comes from scale—researching and developing a series of products enabling her company’s sales to more and more effectively pull the business forward faster than costs could hold it back.
The same principles apply whether you're selling limoncello or semiconductor chips:
Sales should be pulling the business forward. Keep in mind what numbers will always struggle to show - that people and relationships are ultimately what lead to sales.
Quality management, among many other things, should be empowering the decisions, processes, product development, partnerships, and culture that drive higher sales per employee. That’s easier said than done. Products become obsolete. Competitors chip away at a company’s advantages. Partners may become competitors. Customers demand more at lower prices. Sometimes strategies are wrong, new products fail, or a company’s customers fall on hard times. The framework outlined here doesn’t understand these causes and effects.
The framework can only help us, as investors, peer into a company’s numbers and see the outcomes of culture, decisions, and competition.
But know that it all starts with people…people and the relationships they build create sales.
A Personal Note About The Framework and Models
Developing all this has been a journey. Some of you here in the Rickhouse know me and have heard me talk (ad nauseam) about these models since about 2016. Back then, these ideas were a bunch of notes, numbers, and formulas spread across way too many spreadsheets.
I know I said something like, "The models are really close to done. They just need to be polished…maybe a tweak here and there."
Seven years later, here's what I learned: the difference between a good idea and a useful framework is about 10,000 hours of being wrong. The models that looked "almost done" in 2016 were like using Google Maps—you know where you want to go, you think you know the route, but you have no idea how easy or hard the journey will be.
So, thank you to those who listened politely while I figured that out.
As always, the disclaimer:
Nothing here at The Rickhouse is financial advice. Any mentions of specific securities are not recommendations. They can’t be since I know nothing about your financial plans, risk capacity, risk tolerance, or your current financial situation.
The Rickhouse has content to help you see what risks may be in your portfolio. Knowing those risks does not directly translate to making changes in your investments. In fact, more knowledge should help you become more confident in your investment decisions and ask better questions of your financial advisor.
A Note on Sources
The thinking behind the idea that it should be possible to build a model to find the great wealth-building stocks comes from the Bessembinder papers discussed in previous posts. It’s one thing to read about great investors and their methods. It’s a slightly different, but energizing, idea that Bessembinder’s work offers - there is math that demonstrates great wealth-building stocks should exist, they are not likely to last for all that long, and you must be sure you have them in your portfolio.
Bessembinder, Hendrik (Hank), Do Stocks Outperform Treasury Bills? (May 28, 2018). Journal of Financial Economics (JFE), Forthcoming, Available at SSRN: https://ssrn.com/abstract=2900447 or http://dx.doi.org/10.2139/ssrn.2900447
Bessembinder, Hendrik (Hank) and Chen, Te-Feng and Choi, Goeun and Wei, Kuo-Chiang (John), Long-Term Shareholder Returns: Evidence from 64,000 Global Stocks (March 6, 2023). Financial Analysts Journal, Forthcoming, Available at SSRN: https://ssrn.com/abstract=3710251 or http://dx.doi.org/10.2139/ssrn.3710251
However, the work that provided the best direction toward how to find the great wealth-building stocks and how to identify when they begin to decay did not come from a researcher in finance or economics. That paper came from Geoffrey West and a team of researchers associated with the Santa Fe Institute. It was one small part in a much larger project about scale and how an animal, plant, system, city, or company responds to its environment and itself as it grows larger.
Scaling Laws and a General Theory for the Growth of Public Companies
arXiv
2021 | Other
DOI: 10.48550/arXiv.2109.10379
EID: 2-s2.0-85135629700
Part of ISSN: 23318422
Contributors: Zhang, J.; Kempes, C.P.; Hamilton, M.J.; Tao, R.; West, G.B.